Risk Matrix
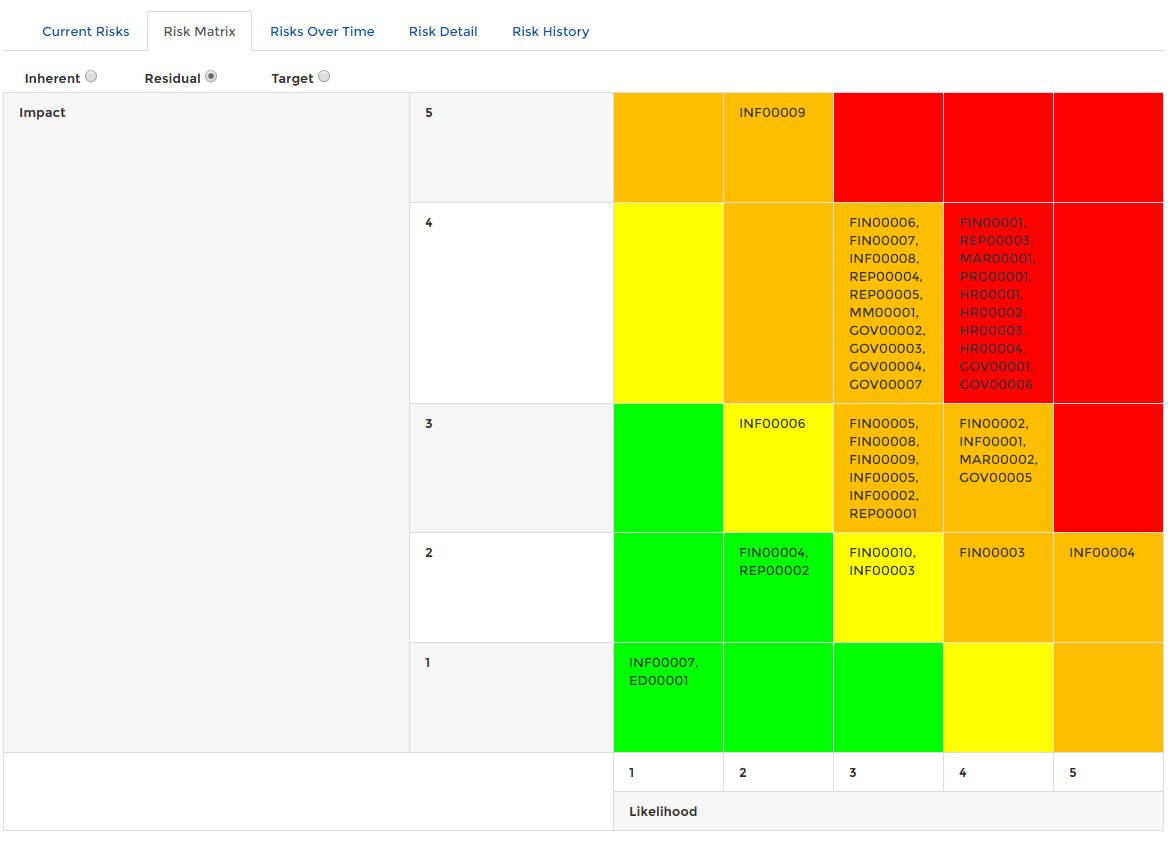
The risk matrix is a graphical representation of an organisation's risk appetite. The risk associated with an item is calculated from the values of associated risk variables. Thiswhich producesform anthe aggregatedaxes 'riskof score'the thatmatrix. The severity of a risk is compareddetermined by comparing risk variable values against the risk matrix to determine the severity of the risk.matrix.
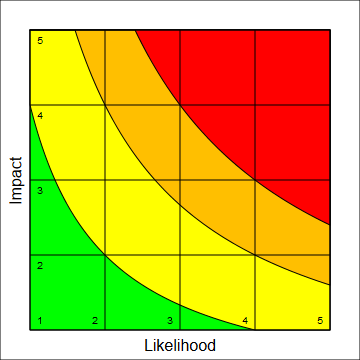
Classic Risk Matrix
It is important to note that the value of the likelihood or impact may not be an integer. This can cause risk scores that are numerically higher to be classed as a lower severity. For example, take the above matrix and assume that the right edge of each table cell is the number indicated (this setting can be customised). If the likelihood has a score of 4.1 and the impact a score of 2.1 then, through multiplication, the risk score is 8.61 and the matrix classifies this risk as red (high). Alternatively suppose that the likelihood is 1.9 and that the impact is 4.9 - the risk score is now 9.31 but the severity of the risk is only orange (medium). This is expected behaviour.
Linear Risk Matrix